
5,976 km to the Arctic in an EV, towing a caravan
What towing did to range and charging on a five-week family trip to Lofoten, using the drives the car logged on the way home.
Aurora over the rig in northern Norway. Photo: Martijn Hermans.
Listen to this note
9 minutes · two hosts talk it through
Chapters
Transcript
AlexThis is the audio version of a Field Notes piece by Martijn Hermans. It's about towing a caravan to the Arctic with an electric car.
SamAnd about what the car's own data says happened. I'm Sam.
AlexI'm Alex. We're both synthetic voices, by the way. The script was written by an AI from Martijn's article, and voiced with PodcastD, the podcast tool he builds himself.
SamSo if we mispronounce a Norwegian town, blame the robots.
AlexOkay, the trip. A 2019 Tesla Model 3. A small Eriba caravan on the back. Their daughter in the back seat. From the Netherlands all the way up to Lofoten, above the Arctic Circle, and home again.
SamFive and a half weeks. Almost six thousand kilometres.
AlexFive thousand nine hundred and seventy-six, to be exact. Not counting the ferries.
SamAnd here's the fun part. While they were on the road, Martijn kept working on little AI projects, mostly over their Starlink connection.
AlexAnd this was one of them. He came up with it once they reached their northernmost point, in Lofoten.
SamThe question was simple. What does towing actually do to an electric car? Range, charging, the way you travel.
AlexBefore they bought the caravan he went looking for real numbers, and couldn't find much in one place. So he started logging.
SamBut there's a catch, right?
AlexThere is. The logging only started in Lofoten. So the whole drive north is missing. The data covers the day trips on the islands and the whole way home.
SamThat's about two and a half thousand kilometres out of almost six thousand.
AlexForty-two percent. And the article is pretty strict about that. On the map, the drive north simply has no line. Nothing is filled in.
SamI like that. A lot of charts would just draw the route anyway.
AlexRight. And every number in the piece is labelled. Measured by the car. Estimated from the data. Or modeled, with physics or weather data.
SamSo, the big question. How much more energy does the car use with a caravan on?
AlexThe raw numbers first. Solo, the car used seventeen point six kilowatt hours per hundred kilometres.
SamQuick translation for normal people?
AlexKilowatt hours per hundred kilometres is the electric version of litres per hundred kilometres. Lower is better.
SamGot it.
AlexSo, seventeen point six solo. With the caravan, thirty point eight.
SamThat's about three quarters more.
AlexIt is. But it's not a fair fight. Without the caravan they were mostly pottering around Lofoten at about forty kilometres an hour. With the caravan they were on the move. About sixty-seven on average, often over mountains.
SamSo you're comparing slow island roads with mountain passes.
AlexExactly. So the analysis adjusts for that. It compares both at the same speed, on a flat road, with no wind, at twelve degrees.
SamHow do you even do that?
AlexIt combines the car's own power readings, about four times a second, with open weather data and the slope of the road. Then it fits a simple model of what it takes to push a car along the road and through the air.
SamAnd the answer?
AlexAt eighty kilometres an hour, the caravan adds about twelve kilowatt hours per hundred kilometres. Somewhere between nine and fifteen. And the central estimate stayed between eleven and fifteen in every variation that was tried.
SamWhich is, funnily enough, still about three quarters more.
AlexClose to the raw gap after all. The gap remains after adjusting for speed, slope and weather. That makes the comparison more useful, but it's still one trip, with very different solo and towing conditions.
SamYou said mountains. Do hills matter much?
AlexFrom one kilometre to the next, they explain more of the difference than anything else in the data. One afternoon, a two hundred and ninety metre climb with the caravan used forty-seven kilowatt hours per hundred kilometres.
SamOuch.
AlexThe next morning, going three hundred and twenty metres back down, the same rig used sixteen.
SamSo it mostly evens out.
AlexOver a whole trip, mostly, yes. The car gets much of it back on the way down.
SamOkay, speed. That's what people actually control.
AlexAnd it's where towing really bites. Air resistance grows quickly with speed, and the caravan adds a lot of it. It's also where the data are thinnest.
SamGive me numbers I can plan with.
AlexOn the model's numbers, at eighty kilometres an hour, towing, you can plan on about a hundred and fifty kilometres between charges. That's from eighty percent battery down to ten.
SamAnd at a hundred?
AlexSomewhere between a hundred and fifteen and a hundred and forty.
SamSo going faster really costs you range.
AlexRoughly fifteen to twenty percent at a hundred, compared with eighty. And a fair warning from the article itself. Almost all of the fast towing happened on one warm day on German motorways. So the curve above ninety is the least certain part.
SamHonest. And the practical rhythm?
AlexCharge to about eighty, drive about a hundred and fifty kilometres, charge again. Which is pretty much what they ended up doing anyway.
SamIs there one day that shows what this looks like?
AlexThe last big one. They came off the overnight ferry in Kiel and drove all the way to the Netherlands in one go.
SamHow far?
AlexThe car logged five hundred and six kilometres. Martijn's own verdict: way too much driving, in hindsight.
SamHa. And the battery?
AlexA sawtooth. Charge to nearly full, tow for one and a half to two and a half hours, arrive somewhere between twelve and twenty-six percent, charge again. Three stops, two and a half hours of charging.
SamAnd the lesson?
AlexThat what makes a day like that work isn't range. It's chargers you can drive through without unhitching the caravan.
SamLet's talk money, briefly.
AlexCharging only. About seven hundred and ninety euros for the whole trip. Roughly thirteen euros per hundred kilometres, towing and solo together.
SamAnd charging speed?
AlexQuick. At the fastest chargers it peaked at around two hundred and fifty kilowatts. After a long climb out of Trondheim they arrived at a charger with six percent, and were back at ninety-two percent forty-one minutes later.
SamAnd the battery itself? It's a seven-year-old car.
AlexIt held up. Measured from nineteen charging sessions, about sixty-seven kilowatt hours usable. By Martijn's own estimate, that's around eighty-eight to ninety percent of what it had new. And it didn't measurably change over the trip.
SamSo the range you lose when towing isn't the battery getting old.
AlexNo. It's physics.
SamThe article has two things nobody warns you about.
AlexFirst, Starlink. They left it running off the car's twelve volt socket one cold night at a wild camp spot. The battery drained about twice as fast as the normal overnight loss.
SamThe fix?
AlexIt now runs off a separate power station, so the car can sleep.
SamAnd the second?
AlexThe ferry confused the car. Driving off the boat in Kiel, the car's GPS insisted they were still in Sweden for the first twenty-eight kilometres. Then it jumped four hundred and thirty-six kilometres south in one go.
SamThat's a very confident car.
AlexHarmless, but strange to watch, he says.
SamSo. Would they do it again?
AlexYes. They'd plan around regular charging stops again, and look for chargers where they can keep the caravan attached.
SamThat's the audio version. The full piece, with the map, the charts, how every number was worked out and how uncertain each one is, is on Field Notes.
AlexThanks for listening.
Made with PodcastD, the in-house tool I build for turning writing into podcasts. Claude wrote the script from this note; the voices are synthetic (Kokoro (am_michael, af_sarah)) and everything was rendered on my own machine.
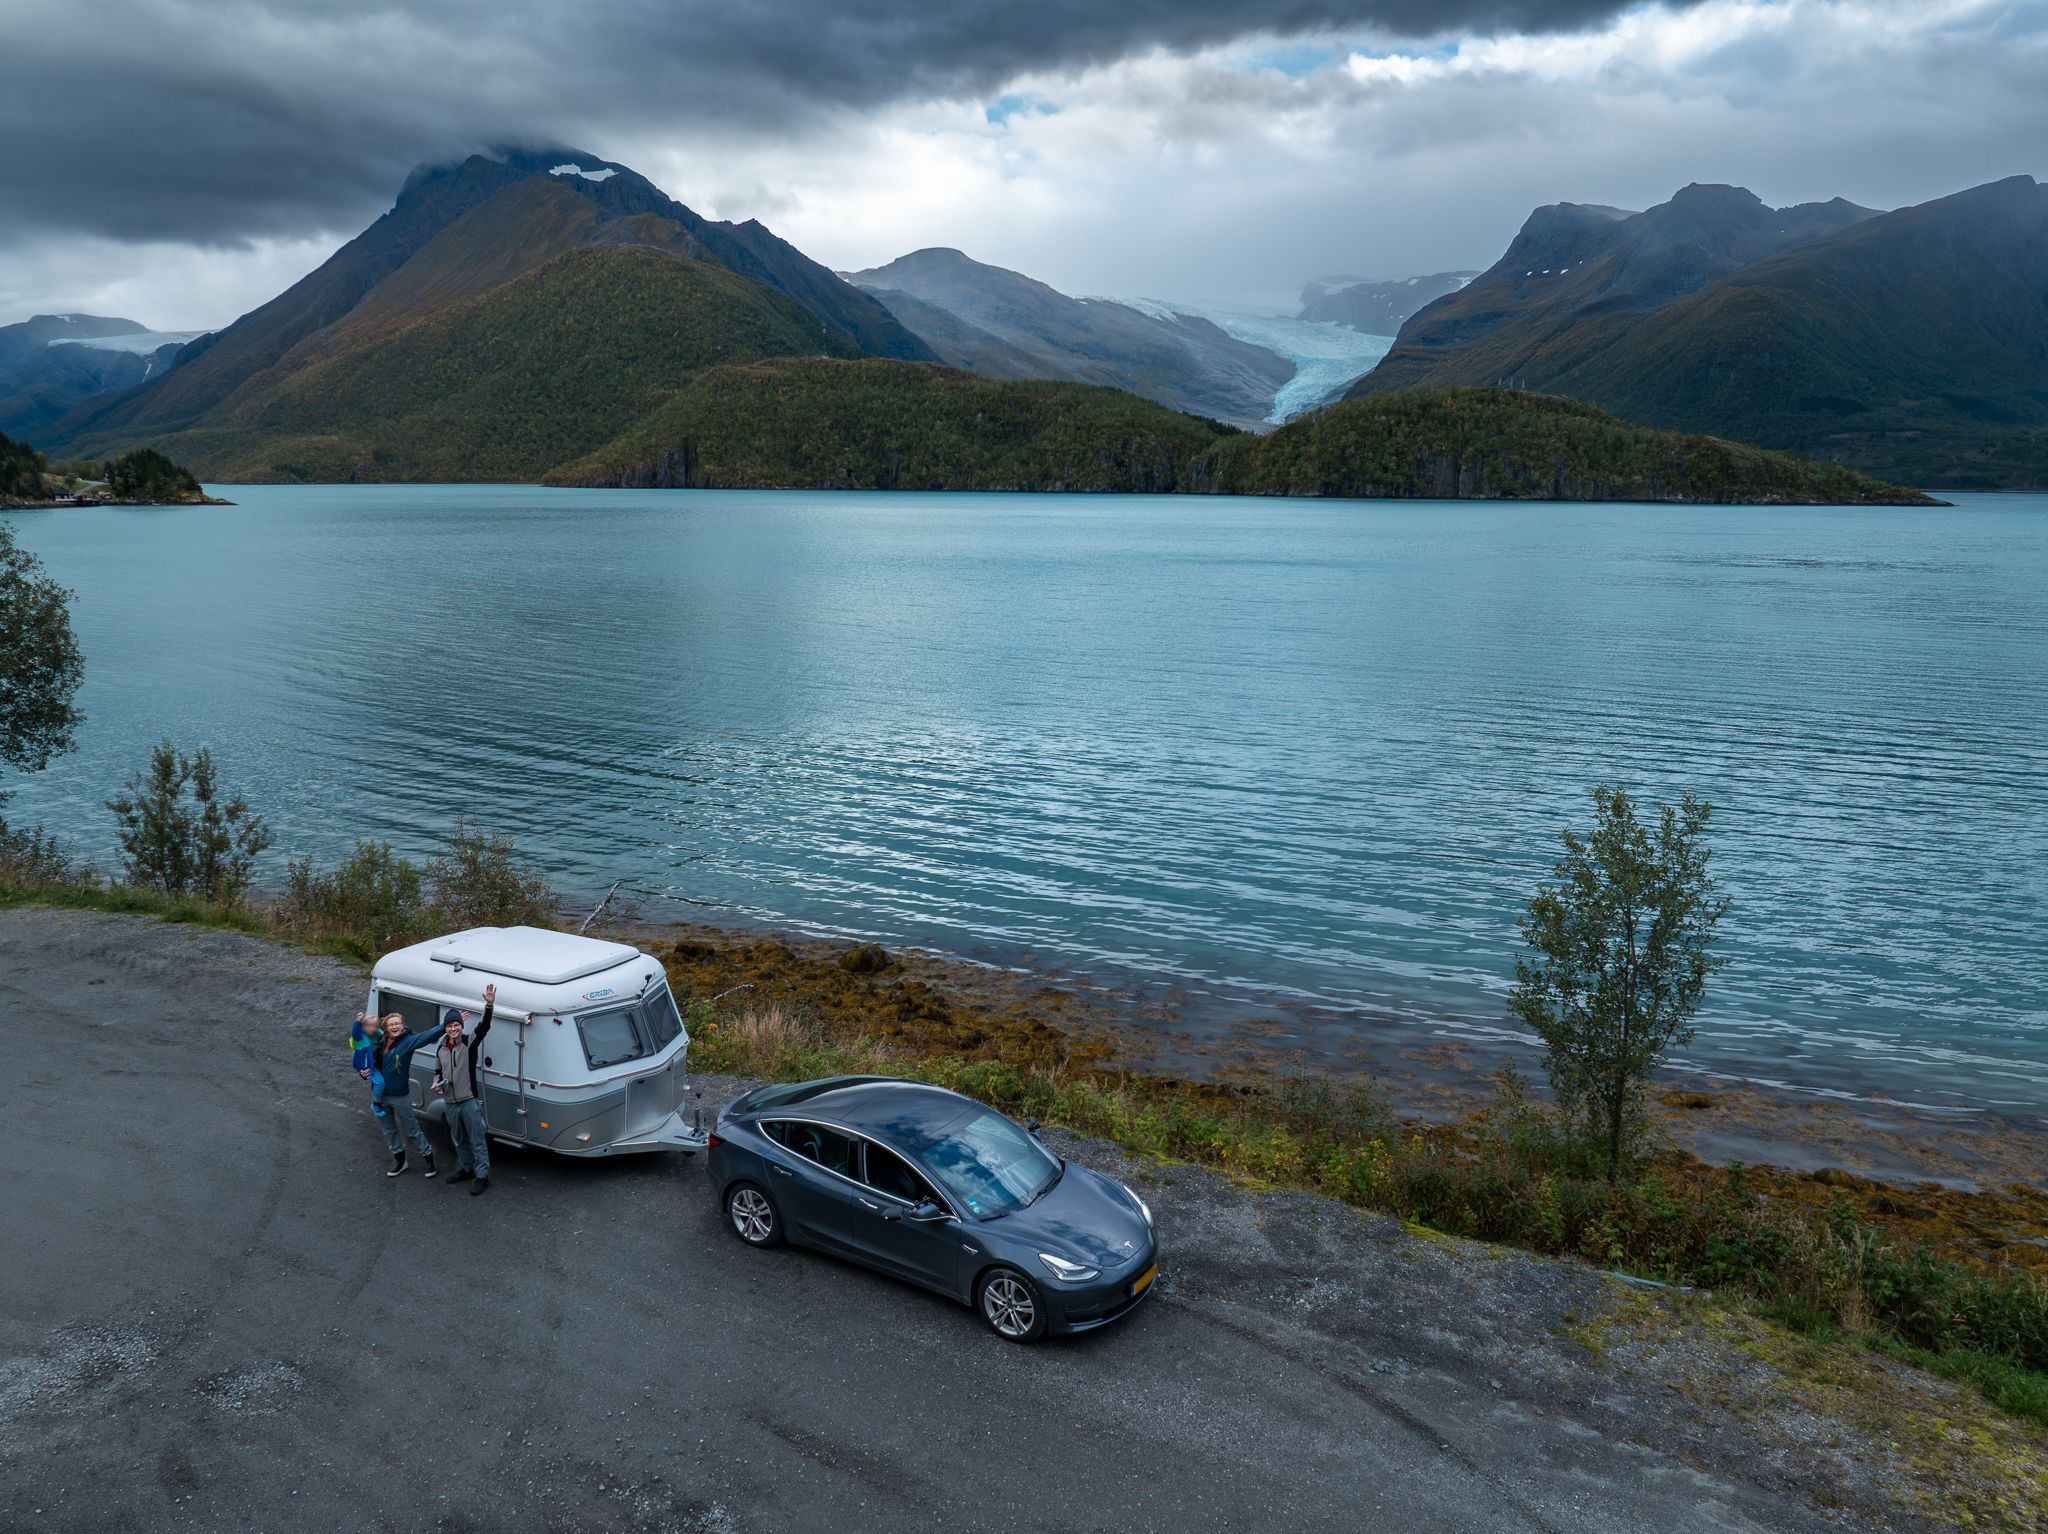
We drove our 2019 Tesla Model 3 to above the Arctic Circle and back, with our Eriba 310 caravan on the back and our daughter in her seat. The Netherlands to Lofoten, five and a half weeks, home again on 20 September.
Before we bought the caravan I’d gone looking for real numbers on towing with an EV. What does it do to range, to charging, to how you travel? I couldn’t find much in one place.
On the road I kept working on all sorts of little AI projects, mostly over our Starlink connection. This was one of them, and I came up with it once we hit our northernmost point, in Lofoten. So that’s where the logging starts. The data covers the day trips on the islands and the whole way home, about 2,500 of the 5,976 km. The drive north isn’t in it.
In short
- With the caravan on, the car used about three quarters more energy per km: 31 instead of 18 kWh per 100 km.
- That raw gap mixes the caravan with very different roads. After adjusting for speed, slope and weather, the caravan still added about 12 kWh per 100 km at 80 km/h (somewhere between 9 and 15). That’s an estimate from one trip, not a controlled test.
- Speed hurts more when towing. On the model’s numbers, 80 km/h gives about 154 km between charges (80 to 10 percent), 100 km/h more like 114 to 140. The faster end rests mostly on one warm motorway day.
- Charging came to about €790 for the whole trip, roughly €13 per 100 km, towing and solo together.
The route
Up through Germany and Denmark, across to Sweden, then the long way north into Norway. We stayed at Lofoten Beach Camp on Flakstadstranda for a good stretch and did day trips with the caravan left behind.
On the way home we took the Kystriksveien coast road, stopped at the Engabreen glacier, spent three nights in Trondheim, and cut back through Sweden to catch the overnight ferry from Gothenburg to Kiel.
Where the car logged its route
Before any comparison, this is what the data covers, and what it doesn’t. Everything below the map comes straight from the car’s own logs.
- Logged by the car
- 2,499 kmof 5,976 km, 42%
- Drives
- 12749 longer than 5 km analysed
- Days with driving
- 16of 18 logged days, 3 to 20 Sep
- Furthest north
- 68.3° NLofoten, 5 September
- Towing
- 2,195 km35 drives
- Solo
- 216 km14 drives, mostly Lofoten
- Sea crossings
- 4Bodø, Jektvik, Nesna, Kiel
- Outside temperature
- 11 to 20 °Caverage per drive
The logged route
From Lofoten home: down the coast, through Trondheim and Sweden, and over the sea to Kiel. The drive north has no line, because it wasn't logged.
Tap or hover a dashed ferry crossing or the 68.3° N marker.
- Measured by the car
- Not logged
Method and data
Road lines are the car’s logged positions, rounded to about 1 km and simplified. Colour shows whether the caravan was on, from the trip diary. Everything in the Netherlands is left off on purpose. The four sea crossings are drawn as straight dashed lines; they are not tracks. For the first 28 km after the Kiel ferry the car’s GPS was stuck on an old position, so that stretch isn’t drawn.
The ferry from Nesna was not in the diary; it shows up in the data as a 6 km jump across the fjord during a 28-minute stop.
How much of the trip is in the data?
Less than half. The car logged 2,499 of the 5,976 km, all of it from Lofoten onwards, on 18 of the 38 days.
Tap or hover a part of the bar or a day.
- Measured by the car
- Not logged
Method and data
Trip distance comes from the odometer at departure (about 90,600 km, a rounded note) and at home (96,576 km). Logged distance is the sum of the car’s drives in Teslamate, 3 to 20 September 2026. Nothing is reconstructed for the drive north. Drives under 5 km are logged but left out of the analysis, because starting and manoeuvring dominate them.
Why 3,474 + 2,499 isn’t 5,976. The 3,474 km is the first logged odometer reading (94,073.8) minus the rounded departure note. About 4 km at the very end, between the last logged drive and the final odometer reading, were not logged. And the drive distances add up to about 1 km more than the odometer moved while logging. So the parts are right to within a few kilometres; the total itself is only as exact as the departure note.
Day by day
Short day trips in Lofoten, then the long pull south. The two biggest days were Trondheim to Elverum and the last push from Kiel.
| Day | Where | Distance | km |
|---|---|---|---|
| 14 Aug to 2 Sep | The drive north and the first days in Lofoten | 3,474 km, not logged | |
| Thu 3 Sept | Lofoten, day trips | 0 km towing, 37 km solo, 4 km in short drives | 41 |
| Fri 4 Sept | Lofoten, day trips | 0 km towing, 37 km solo, 20 km in short drives | 57 |
| Sat 5 Sept | Lofoten, day trips | 0 km towing, 123 km solo, 0 km in short drives | 123 |
| Sun 6 Sept | Lofoten, ferry to Bodø, Kystriksveien | 97 km towing, 0 km solo, 0 km in short drives | 97 |
| Mon 7 Sept | Kystriksveien, Engabreen glacier | 107 km towing, 0 km solo, 15 km in short drives | 122 |
| Tue 8 Sept | Kystriksveien, Jektvik ferry | 102 km towing, 0 km solo, 2 km in short drives | 104 |
| Wed 9 Sept | Kystriksveien, Nesna ferry, Mosjøen | 182 km towing, 0 km solo, 0 km in short drives | 182 |
| Thu 10 Sept | South to Trondheim | 274 km towing, 0 km solo, 4 km in short drives | 278 |
| Fri 11 Sept | Trondheim, no driving | 0 km towing, 0 km solo, 0 km in short drives | 0 |
| Sat 12 Sept | Trondheim, no driving | 0 km towing, 0 km solo, 0 km in short drives | 0 |
| Sun 13 Sept | Trondheim to Elverum | 358 km towing, 5 km solo, 6 km in short drives | 369 |
| Mon 14 Sept | Elverum to the Oslo area | 153 km towing, 0 km solo, 1 km in short drives | 154 |
| Tue 15 Sept | Into Sweden, west coast | 212 km towing, 0 km solo, 1 km in short drives | 213 |
| Wed 16 Sept | Down the coast to Gothenburg | 109 km towing, 14 km solo, 1 km in short drives | 124 |
| Thu 17 Sept | Gothenburg, overnight ferry | 28 km towing, 0 km solo, 5 km in short drives | 33 |
| Fri 18 Sept | Kiel to the Netherlands | 506 km towing, 0 km solo, 1 km in short drives | 507 |
| Sat 19 Sept | Netherlands | 0 km towing, 0 km solo, 19 km in short drives | 19 |
| Sun 20 Sept | Netherlands, home | 76 km towing, 0 km solo, 0 km in short drives | 76 |
- Towing
- Solo
- Short drives (under 5 km)
- Not logged (scale broken: 3,474 km)
Method and data
Kilometres per local day from the car’s drives (measured). Towing or solo comes from the trip diary for drives longer than 5 km; shorter drives are shown separately. Place names are coarse and come from the diary. The first row is not to scale: 3,474 km were driven before the logging started.

What the caravan does to the numbers
First the raw numbers. Solo, the car used 17.6 kWh per 100 km. With the caravan, 30.8. That’s about three quarters more.
But that’s not a fair fight. Without the caravan we were mostly pottering around Lofoten at about 40 km/h. With it we were on the move, about 67 km/h on average, often over mountains.
So the analysis adjusts for that. It combines the car’s own power readings with open weather data and the slope of the road, and fits a simple model of what it takes to push a car along the road and through the air. Then it compares solo and towing under the same conditions: 80 km/h, flat road, no wind, 12 °C. The caravan adds about 12 kWh per 100 km, somewhere between 9 and 15. The central estimate stayed between 11 and 15 in every variation of the analysis that was tried.
The gap remains after adjusting for speed, slope and weather. That makes the comparison more useful, although it still comes from one trip with very different solo and towing conditions.
From a raw gap to an adjusted comparison
The gap remains after adjusting for speed, slope and weather: with the caravan on, the car used about three quarters more energy. That makes the comparison more useful, although it still comes from one trip with very different solo and towing conditions.
Tap or hover a bar for the number and its range.
- Measured by the car
- Modeled (physics or weather data)
Method and data
1: distance-weighted averages over 14 solo and 35 towing drives (measured). 2: one-kilometre stretches of road with an average speed between 70 and 90 km/h (measured). 3: the road-load model’s prediction under standard conditions (modeled, pooled variant). Error bars are 95% intervals from resampling whole drives: 2,000 times, solo and towing drives separately, recomputing the result each time. They show sampling uncertainty only, not modeling choices. Full method.
| Comparison | Solo | Towing | Status |
|---|---|---|---|
| Trip averages (14 solo, 35 towing drives) | 17.6 | 30.8 | Measured |
| Road driven at 70 to 90 km/h | 17.4 | 30.8 | Measured |
| Adjusted (model): 80 km/h, flat, 12 °C, no wind, dry | 16.6 | 29.0 | Modeled |
Hills explain more of the difference from one kilometre to the next than anything else in the data. One afternoon a 290 m climb with the caravan used 47 kWh per 100 km. The next morning, going 320 m back down, the same rig used 16. Over a whole trip that mostly evens out, because the car gets much of it back on the way down.
What speed costs
Speed is where towing really bites. Air resistance grows quickly with speed, and the caravan adds a lot of it. This is also where the data are thinnest, so the chart shows how much the answer moves.
What does speed cost when you tow?
With the caravan on, going from 80 to 100 km/h adds about 5 to 7 kWh per 100 km, two to three times the solo increase. On these numbers a charge gets you roughly 15 to 20 percent less far at 100 than at 80.
Tap, hover or tab to a dot for the exact number and the range it gives.
- Measured by the car
- Modeled (physics or weather data)
How to read this: kWh per 100 km is the electric version of litres per 100 km, so lower is better. The lines show a steady drive on a flat road at 12 °C. The shaded band covers the 95% intervals of two versions of the model, so it shows both the noise in the data and one key modeling choice. Faint dots are what the car actually did on each kilometre of road, hills and wind included.
Method and data
Data. 2,208 one-kilometre stretches of road from 49 drives, 3 to 20 September 2026. Energy is the battery’s power reading added up over time (measured). Temperature, air pressure and wind come from Open-Meteo’s archived weather model; slope from the car’s own elevation readings.
Model. Energy per km = power for the car’s own systems divided by speed, plus rolling resistance, plus air drag (depending on air density and the wind-adjusted speed), plus climbing. Fitted separately for solo and towing. The line is the pooled variant, which uses one road resistance for the whole trip.
The band. Two variants were fitted: pooled, and within-day, which gives every day its own road resistance. For each, whole drives were resampled 2,000 times and the model refitted, giving a 95% interval. The band runs from the lower of the two lower bounds to the higher of the two upper bounds. It covers sampling uncertainty under both road treatments. Other choices (standby power, a temperature term, wind and wet-road rules) are tested separately; at 80 km/h they move the towing gap between about 12 and 15.
Range. 80 to 10 percent of 67 kWh is 46.9 kWh. The car’s battery percentage falls about 5% faster than its power readings add up to (1.052, measured over drives longer than 20 km), so range = 46.9 ÷ (kWh per km × 1.052). At 80 km/h towing: 46.9 ÷ (0.290 × 1.052) is about 154 km. Without that correction it would be about 162 km. It is a measured correction, not a safety margin.
Limits. Almost all fast towing was one warm day on German motorways, so the towing curve above 90 km/h is the least certain. We never drove solo above about 90 km/h; the solo curve there is extrapolated (dashed), and the solo speed slope comes from the car’s published drag figure, not from our driving. One car, one caravan, late summer. Full method.
| Speed | Solo | Towing | Towing range, 80 to 10% (central, band) |
|---|---|---|---|
| 50 km/h | 15.4 | 25.1 | 177 km (164 to 215) |
| 60 km/h | 15.5 | 26.0 | 172 km (160 to 198) |
| 70 km/h | 15.9 | 27.3 | 164 km (154 to 180) |
| 80 km/h | 16.6 | 29.0 | 154 km (142 to 162) |
| 90 km/h | 17.6 | 31.1 | 143 km (128 to 150) |
| 100 km/h | 18.8 | 33.6 | 133 km (114 to 140) |
| 110 km/h | 20.2 | 36.4 | 122 km (102 to 130) |
In practice: on the model’s numbers, at 80 km/h you can plan on about 154 km from 80 percent down to 10 (band 142 to 162). At 100 km/h it’s somewhere between 114 and 140. That matches the rhythm we ended up with anyway: charge to 80 or so, drive about 150 km, charge again.
A day on the road
After the overnight ferry we drove off in Kiel and did the whole way to the Netherlands in one go. Way too much driving, in hindsight. The car logged 506 km of it.
The rhythm is the same all day: charge to nearly full, tow for one and a half to two and a half hours, arrive somewhere between 12 and 26 percent, charge again. Three stops, two and a half hours of charging. What actually makes a day like this work isn’t range, it’s chargers you can drive through without unhitching.
What does a long towing day look like?
A sawtooth. Three long stints, each ending between 12 and 26 percent, each followed by a fast charge back to nearly full.
Tap or hover a drive, a charge or an arrival.
- Measured by the car
How to read this: the line is the battery level through the day, as the car reported it. It falls while driving and climbs at a charger. Where the line breaks, the car wasn't reporting; nothing is drawn in.
Method and data
Battery level from the car’s logs, 18 September 2026, local time. Drives and charges as logged; gaps are left as gaps. The first 28 km after the ferry had a stuck GPS position; the battery and distance readings are unaffected.
Charging and the battery
Charging came to about €790 over the whole trip, roughly €13 per 100 km. That’s the average across towing and solo driving, electricity only.
Fast charging was quick. At the fastest chargers it peaked at 245 to 252 kW. After a long climb out of Trondheim we arrived at a charger with 6 percent and were back at 92 percent 41 minutes later.
The battery held up. Measured from 19 charging sessions, it has about 67 kWh usable. By my own estimate that’s around 88 to 90 percent of what it had new, and it didn’t measurably change over the trip. The range you lose towing isn’t the battery ageing, it’s physics.

Two things nobody warns you about
First, Starlink. We left it running off the car’s 12V socket one cold night at a wild camp spot. The battery drained about twice as fast as the normal overnight loss. It now runs off a separate power station so the car can sleep.
Second, the ferry confused the car. Driving off the boat in Kiel, the car’s GPS insisted we were still in Sweden for the first 28 km, then jumped 436 km south in one go. Harmless, but strange to watch.
Would we do it again?
Yes. We’d plan around regular charging stops again, and look for chargers where we can keep the caravan attached.

The rig
- Car
- Tesla Model 3 Long Range, 2019
- Battery
- About 67 kWh usable, measured from charging on this trip
- Tyres
- Pirelli Cinturato All Season SF3, 235/45 R18 98Y XL
- Wheels
- MAK, 18-inch
- Caravan
- Eriba 310, about 900 kg
How this was made
I started the logging and sent daily updates on when the caravan was on, including the days with both solo and towing drives. Those notes are where every towing label in this piece comes from.
The logging and the first analysis happened on the road. Over Starlink and Tailscale I connected to my own small setup at home in Amsterdam: the car’s logging ran there, and so did the AI agent I worked with from the campsite.
A first version, run from the campsite, put the caravan’s effect at 49 percent. It used 34 drives, an approximate energy measure and no uncertainty, so I kept it out of this piece until it was redone with the full data. That redo is what you see here, and the 49 percent didn’t hold up.
For the redo I asked for more than averages: regressions, open weather data, an estimate of road conditions, and charts that someone new to EVs can follow. AI coding agents did the data work: pulling the car’s logs, matching the weather and the slope of the road, fitting the models and testing how much each answer moves when an assumption changes.
- The car’s logs. Teslamate, 3 to 20 September 2026: 127 drives and 2,499 km. Energy is the battery’s power reading, added up over time.
- Weather. Temperature, air pressure, wind and rain matched to every kilometre, from Open-Meteo’s archived weather model.
- Slope. The car’s own elevation readings.
- Caravan on or off. From my daily notes, not from the car. Two drives on 17 September are uncertain; leaving them out changes nothing.
- What was analysed. 49 drives longer than 5 km, cut into one-kilometre stretches; 2,208 of them went into the models.
- Limits. One car, one caravan, late summer. Solo driving was almost all slow island roads, and most of the fast towing was a single warm day on German motorways. Wind and rain come from a weather model, not from the road itself. The drive north wasn’t logged.
- Measured by the car
- Estimated from the data, with uncertainty
- Modeled (physics or weather data)
- Not logged
I work on products, lead teams and build with AI. More about me and my own AI tools on martijnhermans.nl. Back to Field Notes.